Chart Wizard - Pie Chart Properties
Pie charts are best used when categorically breaking down your data into pieces, or "slices" of a whole. This can be especially useful when comparing the visual proportion of your values (so long as no value is equal to 0), or more plainly, bigger areas versus smaller areas.
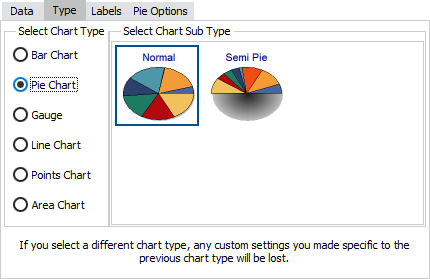
After you have selected a pie chart from the list of chart types on the Type tab, you can then select a chart sub-type and configure various chart options.
Pie Chart Sub-Types
Classic charts give you the option of a Normal pie chart or a Semi Pie. The Semi Pie displays the data in a 180° semicircle instead of a full 360° circle.
Standard charts support only the Normal sub-type.

![]()
Multiple Series with Pie Charts
Classic charts in the Argos client allow you to construct multiple side-by-side pie charts, or to overlay a pie chart on another chart type, when you have more than one series in a chart.
When using standard charts, or classic charts in the Web Viewer, you will need to create a separate pie chart for each series. You can then position each chart wherever you choose in relation to the other chart(s).
Pie Chart Options
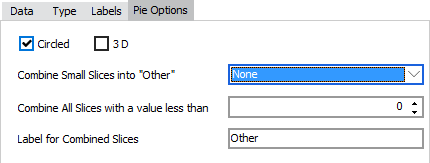
Classic charts provide several additional configuration options for pie charts via the Pie Options tab:

- Circled - When checked, the pie chart will be a regular circle. When unchecked, the circle will stretch into an oblong to fit the available space.
- 3D - Angles the chart to simulate a three dimensional view.
- Combine Small Slices into "Other" - Groups smaller slices into one to improve the look of the chart.
- Combine All Slices with a value less than - Sets the cut-off point for choosing which slices to group together.
- Label for Combined Slices - Allows you to set a custom label for the grouped slices.
Standard charts do not have any configurable options for pie charts.
See also: Configuring Series Labels